Maxine Pfannkuch and Constance M. Brown
The University of
Auckland, New Zealand
Journal of Statistics Education v.4, n.1 (1996)
Copyright (c) 1996 by Maxine Pfannkuch and Constance M. Brown, all rights reserved. This text may be freely shared among individuals, but it may not be republished in any medium without express written consent from the author and advance notification of the editor.
Key Words: Allowing students to experience variation; Fostering students' awareness of their thinking; Probability as a tool to understand variation.
Students of statistics must be allowed to experience the omnipresence of variation and experience the dual modes of thinking probabilistically and deterministically to explain that variation. A pilot study to investigate the understanding of variability and probability of a small group of students is described. These students have a strong tendency to think deterministically (especially in real world settings); they have little understanding of variability and its relationship to sample size; and they are generally unable to reconcile their intuitions with the formal probability they have been taught. There were some initial indications that allowing students to experience variation personally made them more aware of their over-emphasis on causal explanations of variability. Lastly, it appears that students' awareness about probabilistic thinking can be raised by actively challenging and discussing their tacit intuitive models about chance.
1 The question might be raised: Is it necessary to teach probability to enable students to understand and interpret data, and if so, what particular aspects of probability should be taught and how? The importance of finding answers to such questions is highlighted by Garfield and Ahlgren (1988) in their recommending a research effort that ``explores how useful ideas of statistical inference can be taught independently of technically correct probability'' (p. 57). This paper describes a pilot investigation into students' understanding of probability and variation and teaching methods to develop that understanding. This work is part of a larger study designed to give an insight into what aspects of probability should be taught in an introductory tertiary statistics course and how they should be taught.
2 Moore (1992) suggests that too much probability is taught in statistics courses and that only the necessary minimum should be taught to further statistical thinking. He argues that for statistical thinking, the learner should be aware of the omnipresence of variation and how this variation is quantified and explained (Moore 1990). He suggests that current approaches to teaching statistics do not develop this awareness in students. He concludes therefore that there is a need to revolutionise our teaching approach (1992).
3 Towards this reshaping of our teaching of statistics, we might consider the idea of ``cognitive apprenticeship'' described by Singer and Willett (1993). They claim that ``learning occurs most effectively when learners engage in authentic activities with community members [statisticians].'' To engage students in ``cognitive apprenticeship'' they say statistics educators must: (1) select authentic activities, (2) model practitioner behaviours, and (3) provide practice opportunities. Accepting this approach implies that our teaching of probability should reflect the ways in which probability is used by the practising statistician when analysing data (in both the exploratory and confirmatory contexts). This of course may pose a problem when courses are taught by people who have no experience as practitioners of statistics. Authentic activities may also be far too complex for first year statistics classes.
4 To analyse and interpret data the statistician requires a mixture of deterministic and non-deterministic thinking. Biehler (1989) comments, however, that beginning teaching in probability focuses on almost ideal random situations that do not allow students to practise this dual way of thinking. Any set of data (apart from the rare extreme case) will contain variation. The statistician will extract or identify systematic influences, which form the so-called deterministic part of the model that is constructed to describe the data. But these factors will rarely account for the full variation observed. Because the non-systematic causes underlying this variation cannot be analysed directly, they are conveniently described as random. An experienced statistician is able to judge when the search for causes ends and the acceptance of random variation begins. Thus, an expert data analyst will have a thorough grasp of the role of variation, and will understand how to describe and quantify this random variation through the language of probability. A statistician is someone who is comfortable thinking probabilistically as well as deterministically. Our task is to enable our students to do the same.
5 Falk and Konold (1992) hold the opinion that probabilistic thinking is an inherently new way of processing information as the world view shifts from a deterministic view of reality. They state: ``In learning probability, we believe the student must undergo a similar revolution in his or her own thinking ... We advocate starting the process of probabilistic education by building on the firm basis of students' sound intuitions'' (p. 151, 152).
6 Borovcnik and Bentz (1991) suggest that conventional teaching of stochastics (probability and statistics) establishes too few links between the primary intuitions of the learner and the clear cut codified theory of the mathematics. They suggest that teaching has to start from the learners' intuitions, attempting to change and develop them. Borovcnik (1990) indicates that a logical thinking approach and a causal thinking approach are accessible at the intuitive level, and that teaching must develop secondary intuitions that clarify how stochastic thinking is related to these approaches. This raises the question as to whether our current teaching of probability and statistics sets up too few links with students' deterministic thinking and does not raise their awareness of a probabilistic interpretation.
7 Fischbein (1987) asserts that ``intuitions are always the product of personal experience, of the personal involvement of the individual in a certain practical or theoretical activity'' (p. 213). He suggests that the role of the teacher is to make the students aware of the tacit intuitive models present in their thinking and develop in them the ability to control their intuitive biases while building new intuitions consistent with a formal structure. He states: ``Primary intuitions are usually so resistant that they may co-exist with new superior scientifically acceptable ones. That situation very often generates inconsistencies in the students' reactions depending on the nature of the problem. A student may understand logically and intuitively that when tossing a coin several times, each outcome has the same probability. Nevertheless he may still feel intuitively, that, after getting tails 3-4 times in succession, there is a greater likelihood of getting `heads' on the next toss'' (p. 213). Fischbein believes that ``one of the fundamental tasks of mathematical education ... is to develop in students the capacity to distinguish between intuitive beliefs, intuitive feelings and formally supported convictions'' (p. 209).
8 In our opinion a formal mathematical approach to teaching probability may serve as an obstacle to the development of statistical thinking. A pilot study was therefore set up to investigate probabilistic learning in a small group of adult students who were being taught formal probability. In particular, answers were sought to the following questions: (1) What understanding of variation do students have? (2) How do they think about probability in various contexts? (3) What can be done to increase their understanding of variation and probability? It is intended that this study will help in the design of a more comprehensive investigation of probabilistic learning amongst tertiary students.
9 The pilot study consisted of three phases, each of which was intended to build up a more complete understanding of some students' thinking. Phase One consisted of individual interviews designed to provide tentative answers to questions (1) and (2). On the basis of this first interview, a one-day course (Phase Two) was designed to experiment with some ideas about teaching approaches, towards a possible answer to question (3). Phase Three was a follow-up interview in which apparent changes to understanding were investigated.
10 Five female students, all majoring in psychology for their degree and currently enrolled in a first year statistics course, volunteered to take part. Three students were aged over 35, two students were between 30 and 35. The last time they had studied mathematics was at least 15 years ago. The highest level studied was one student to Year 12 (last year of school), one to Year 11, one to Year 10 and two to Year Nine. It was not intended that these five students should be a representative sample. The five women showed a commitment to learning and seemed to be an ideal group with which to gain an insight into some students' thinking. At the time of the interview they had completed course work on `Tools for Exploring Data' (includes numerical and graphical summaries) and `Probability' (includes simple probability, probability rules, conditional probability, and statistical independence). The students were interviewed individually for about one hour. They were told that the interviewer was interested in their thinking and reasoning rather than in their getting the `correct' answer. Consequently they were asked to `think aloud' during the interview. The questions were presented orally and on paper. Unplanned probes were used to clarify the student's thinking for the interviewer. The interviews were audiotaped.
11 The interview included the following items, among others. When quoting responses to the interviewer's (I) questions, individual students (S) are not identified.
Roulette Wheel Question (adapted from Lovitt and Lowe 1993): A roulette wheel has 18 black (B) and 18 red (R) numbers. The probability of a ball landing on a red is the same as landing on a black. A gambler observes the ball to land on red six times in a row, that is RRRRRR. What do you expect the next colour to be?
12 A typical response to this question was that ``intuitively'' the next one should be black, but thinking ``probabilistically'' it could be either red or black. Students often experience such a clash between their intuitions and probabilistic thinking. An effect may be that they rapidly learn to distrust their intuitions but do not understand why their intuitive response is wrong and hence they return to their intuitions again. They are also not shown that, with development and refinement, their intuitions can lead them in the right direction. The paradox is, that in an actual game, they are asked to choose the colour of the next ball. This paradox can only be resolved by simulating such a situation and understanding a logical explanation. One student had the following conversation with the interviewer:
S: ``Black.''
I: ``You expect it to be black. Why would you expect it to be black?''
S: ``Well, it could be black or red, 'cause the probability is the same. I think, yeah, it could be black or red.''
I: ``Black or red ... But initially you said black ... Why did you say black?''
S: ``Because there's all red that have come out so it must be time for a black to come out.''
I: ``So that was your initial thought ... So why did you change your mind?''
S: ``Because the probability is the same, the chances are the same that either a black or red could come out.''
13 This reaction supports Fischbein (1987) who implies that a student can ascribe to two beliefs. The above student, on the one hand, knows that the random nature of the roulette wheel means she cannot say which colour will appear next. Yet, on the other hand, her intuition leads her to suggest that, in order to balance out the run of reds, a black must appear next. The students' responses affirmed our belief of their need to discuss and experience this situation fully to both convince themselves of a logical explanation, and to become more aware of their inappropriate and appropriate intuitive models. From a teaching perspective it appears that too few links with their primary intuitions have been established (Borovcnik 1990) and hence their intuitive beliefs have not been used or resolved.
Baby Question (adapted from Lovitt and Lowe 1993): The Smith family has had three girls. What do you expect their next child to be?
14 Apart from one student the standard response was that it was equally likely to be a boy or girl. Based on typical classroom assumptions that each sex is equally likely, and successive conceptions independent, the similarity to the roulette wheel was presumably transparent. The student who believed that a girl was more likely was drawing on her experience as a nurse, giving causal explanations for her answer. She believed that as more girls were produced by one mother, the likelihood of another girl increased. Later on (after the interview), she recalled statistics produced in class that showed that the probability did increase but only very slightly. The student was very surprised as she thought, from her experience, that the increase was much greater. This experience influenced her thinking every time she was presented with a medical type problem. She says:
S: ``You are supposed to know that they have an equal chance of having a girl or a boy. I really dispute that. That's what was in our book, but I felt logically, I know a lot of families who have four of the same sex and that is put down to the fact that the sperm decide on the sex of the child and it is not an equal chance ... so when I read the statistics I found it surprising ... it was .52 and .48 ... Now I remember what we did in class ... they took 40,000 births and it was just a slight increase [in the chance of a same sex child following]. So you're saying at what point do I take from not being half and half ... after two when you get up to three I do see strong trends to having the fourth child the same gender ... I believe there is more to this than the game of LOTTO, ... it's actually some real world data.'' [LOTTO is a state lottery in New Zealand and is fairly common in North America.]
15 Tversky and Kahneman (1982) refer to this availability bias in judgment: ``The lack of an appropriate code also explains why people usually do not detect biases in their judgments of probability. A person could conceivably learn whether his judgments are externally calibrated by keeping a tally of the proportion of events that actually occur among those to which he assigns the same probability. However it is not natural to group events by their judged probability. In the absence of such grouping it is impossible for an individual to discover, for example, that only 50 percent of their predictions to which he has assigned a probability of .9 or higher actually come true'' (p. 19).
16 From the students' responses it appears that such strong beliefs need to be challenged and resolved satisfactorily, perhaps treating the student as a scientist, as advocated by Konold (1991). It appears also that mathematical modelling, and assumptions, must be made explicit when real data is explored. These observations suggest that the complexities within data, such as the female to male birth ratio, should be discussed openly and fully. Further, students should be aware that their life experiences may cause them to overestimate a probability, particularly if the consequences have an impact such as the fourth child being another girl, and may be influencing their interpretation of the data. If students were to become aware of their own thinking, and experience data that conflict with their prior beliefs, it is possible that they may modify their intuitions appropriately.
Map Question: Every year in New Zealand approximately seven children are born with a limb missing. Last year the children born with this abnormality were located in New Zealand as shown on the map (Figure 1). What do you think? (In New Zealand it is common knowledge that one-third of the population lives in the top region and one-sixth of the population in each of the other regions.)
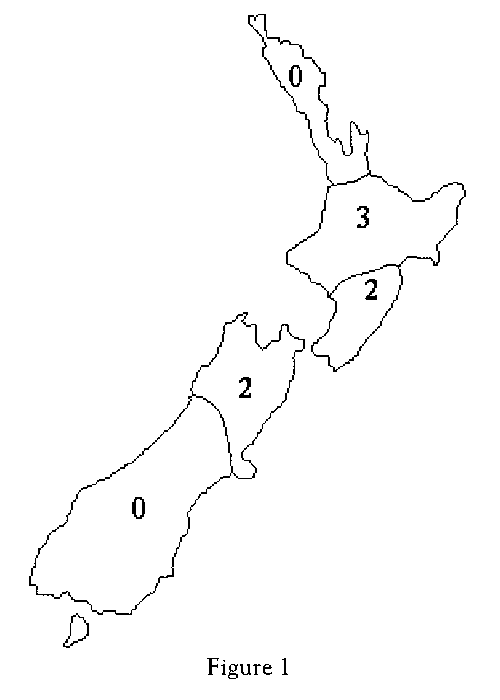 Figure 1. (4K gif)
Figure 1. Map Question.
17 In this context all the students produced deterministic explanations. After repeated probing by the interviewer, some did suggest the need for further data.
S: `` I would look at what is similar in the environment ... type of farming, or pollution or families with genetic defects or something like that living in those areas ... there are a very small number of children, seven, so might have to build up the statistics over a longer period of time.''
18 This non-gambling problem produced very strong deterministic reasoning. All students had obvious experience of such controversial data from the news media and their reasons reflected current concerns in the community. Because their thinking had never been explored or challenged from a statistical point of view, their rich experience had lead to a causal analysis only. Probabilistic and deterministic thinking should complement each other in working towards a full explanation of the data. The students seemed oblivious to the former. From their responses, it was clear that their understanding of variation in small samples was minimal in this context. The idea of statistically modelling such a situation did not occur to them.
Die Toss Question: A fair die is tossed 7 times resulting in the outcome 3,3,3,4,4,5,5 (order is unimportant). What do you think of these results?
19 All students agreed that this outcome was not surprising, and did not necessarily indicate anything amiss with the die. Note the analogy between this problem and the Map Question. (The top region has one-third of the population and corresponds to obtaining a 1 or a 2 on the die, and each of the other regions with one-sixth of the population correspond to obtaining a 3, 4, 5 and 6. There are seven abnormal births and seven tosses of the die.) When context is removed and the familiar die is introduced, students are comfortable thinking probabilistically.
Test Results Question: A small class was given a test on arithmetic and the results were recorded. The same test was given a few weeks later. The box-and-whisker plots for both sets of results are shown (Figure 2). Have the results changed much? If so, can you give any possible reasons?
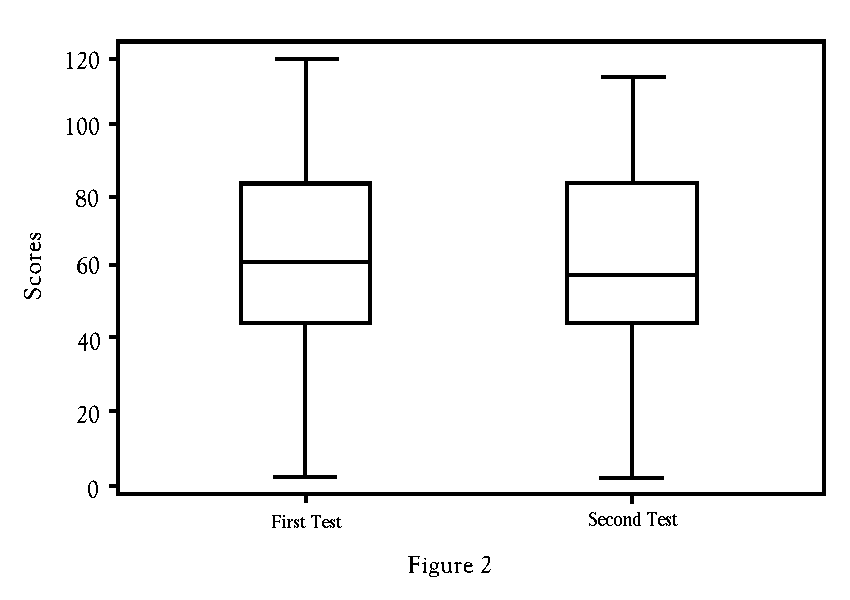 Figure 2. (5.9K gif)
Figure 2. Test Results Question.
20 Again when context was introduced all students produced deterministic explanations. Searching for causal explanations is a crucial component of any analysis, but it cannot lead to a full explanation of the data. No one considered thinking probabilistically except for one student who responded when emphasis was placed on the key word `small' by the interviewer:
S: ``I mean it's not a great deal of difference ... so I tend to feel that the difference is possibly due to chance or those [causal reasons] that I have just mentioned.''
21 Students relied on their experience and sought causal reasons. They were thinking at an individual level only (e.g., arguing that a particular student may have been tired for the second test), whereas a statistician can think at both a local and a global level.
Coin Toss Question: A fair coin is tossed 50 times resulting in 27 heads. Two days later it is tossed again 50 times resulting in 30 heads. What do you think of these results?
22 The coin toss problem was answered correctly and without equivocation. All students appeared comfortable, in this context, with the notion of long run relative frequency. This concurs with Konold (1989) who quotes Nisbett as suggesting that ``most adults use formal, probabilistic knowledge when reasoning about situations that are clearly probabilistic and have a simple sample space'' (p. 88).
23 Based on our reading, and interpretation of these interviews, the decision was made to focus the one-day course on:
24 Two weeks after the interviews, a one-day, five-hour course was held. Twice during the day, students were asked to write down what they had learnt. At the same time the interviewer wrote down her impressions of the course. A decision was made with the group that a tape recorder would be too intrusive in this context.
25 The course was interactive, involved a lot of discussion, challenging of ideas, practical activities, and simulations. Students were encouraged to think aloud and clarify their ideas. The instructional approach was based on these criteria (Konold 1991): Students (1) reveal their own beliefs first and then listen to the beliefs of others; (2) think about the problem deterministically and probabilistically; (3) observe through a hands-on simulation the results of a random process and communicate and discuss what they are thinking; (4) observe through a computer simulation the results of a random process from small to large samples and communicate and discuss what they are thinking; (5) reflect on and evaluate what they originally thought in comparison to their observations from the data; (6) reconsider the dual modes of thinking probabilistically and deterministically for the explanation of variation. It was believed that simulations would enable students to experience variation and hence strengthen their understanding. The first criterion was considered to be important because students need to reveal their intuitions and have a personal involvement in the task, and it is also a base for the teacher to build on.
26 First an overview on deterministic and probabilistic thinking was given including a diagram showing that it was necessary to do both when presented with a situation. Current research relevant to the students' learning and Phase One answers were discussed (Borovcnik and Bentz 1991; Falk and Konold 1992; Fischbein 1987).
27 To enhance their awareness of variation, several situations were presented to the students. Each time they were asked to think about the problem both deterministically and probabilistically. The following quotes illustrate the students' coming to terms with variation and probabilistic thinking. For example they were asked to measure the length of a page and the results were then plotted on a graph.
S: ``But what if one person measured the paper 1000 times? ... [realisation that there would be variation] ... oh, so each of us would have our little curve and all our little curves would make one big curve!''
28 Another situation discussed was the case of a netball (form of basketball) player with an average success rate of 80% for getting a goal. In an important match she missed three shots in a row.
S: ``[ Different] types of thinking in statistics ... allowed me to firstly think: 'What type of process I am using?' When examples were discussed, I was aware of thinking intuitively, deterministically and had to sift mentally quite hard to think in statistical terms. When the netball example was presented and discussed, I could think and understand statistically that the scores are due to chance variation. Intuitively I could also say it was because of bad form, off day etc. I like the ease and variability to have the ability to think a little clearer concerning each problem presented.''
S: ``The most useful thing was to recognise the underlying 'need' to explain variation by naming causes, and being able to `reconceptualise' to accept a degree of ever present variation.''
29 This section ended with a discussion on defining variation according to Falk and Konold (1992). The idea that many causes exist of which we are ignorant was discussed, and chance or variation was defined as an ``irreducible part of natural phenomena'' (p. 151).
30 In presenting a probabilistic way of thinking the teacher must be aware of the danger of students now believing that every situation can be answered with the stock phrase ``random variation.'' Setting up a model of thinking in diagrammatic form for the explanation of variation should keep students referenced on the dual modes of thinking. Criterion (6) in the instructional approach is important to avoid this danger and to give students confidence in listening to their own intuitions.
31 The Test Results Question from the initial interview (Phase One) was discussed, including the original answers given in the interview. Computer simulations were used to show (via boxplots) how sampling variation depends on sample size. Samples of size 20, 50, and 500 were generated. The students were very surprised at the amount of variation for samples of size 20 and 50 and the amount of stability in the large samples. A typical comment was:
S: ``[I realised] that the sample of a population is never totally representative of a population. Hence the variation.''
32 The Map Question from Phase One was discussed, including the interview answers given, and again students were asked to think deterministically and probabilistically. They agreed on the probabilities for each region (based on the population distribution) and then simulated the problem by tossing a die seven times repeatedly and recording their results on the maps. They shared their results and then used the computer to simulate the problem seven times and then 300 and 600 times. The following quotes illustrate the students' heightened awareness of their thinking in real world contexts:
S: ``The value of realising our bias to use deterministic thinking, especially applied to human problems, is very useful.''
S: ``I can see that it takes a reasonably sized sample to give you a representative picture of the population. I'm a very visual learner and the computer graphics helped. I think I can now see how `human' problems have been different for me in the past, from number problems.''
S: ``I tend to think intuitively about human examples allowing emotion to cloud. [I] need to apply statistical thinking to the problem.''
S: ``I feel more aware of being able to reason statistically across a broader range of concepts and problems. I also feel I have a greater understanding between the results gained from small and large samples, small samples giving a greater variation.''
33 The die simulation was perhaps even more powerful in demonstrating variability than the computer simulation. The students personalised it greatly. They thought of each lot of seven rolls as data from consecutive years and they declared their concern after getting four abnormalities in Auckland (the uppermost region, containing one third of the population) three years running. The question they came to was ``When would you start to get worried and not put the results down simply to variation?'' Below is part of a conversation amongst the students demonstrating the re-evaluation of their own experiences in light of the experiments:
S: ``If you had four abnormalities in Auckland you could investigate and find a cause -- you would be bound to find something in common between the four. When I was pregnant, there were four of us pregnant in the lab, I was the only one with a normal baby and [even] he had hepatitis! No one was interested in investigating -- it could have been chance but ... I keep thinking of those three women in Christchurch who worked for the city council with babies that had defects. The women were sure it was the pesticides they were handling but after investigation they came to no conclusion.''
S: ``Now I know why it took so long to conclude that there was a cause for cot deaths and thalidomide.''
S: ``It takes a while to prove things have a cause statistically when samples are small. It is hard not to believe there is a reason -- that it is variation -- [but we] can't treat people like dice -- human lives are at stake.''
34 The next stage in instruction would be to address the concern of the students as to ``When would you start to get worried?'' The first stage would be to remind students of the two modes of thinking and that an explanation for the variation should be sought. If no common or systematic cause could be found then a record of the numbers of abnormal births should be kept over the years. If there is some causal factor it should show up in increased numbers or a change in trend. To enhance their understanding of seeing systematic variation through the random variation, a simulation of the situation should be developed by the teacher. (This was done in a later study.)
35 Another problem discussed (adapted from Lovitt and Lowe 1993) was one that described a situation where a person had tossed a coin and had obtained four heads (H) in a row. They were then asked what they would expect in the next 16 tosses. Some thought that there would be a balancing out so they would expect more tails (T), some thought the results would yield half heads and half tails, and one student said she didn't know (the word `expect' was interpreted as predict). The students first simulated the experiment by tossing coins, with the proviso that they must get four heads first before they could start counting. Next the experiment was simulated on the computer, and then a tree was drawn to help the students think about the problem logically.
36 Again the personal tossing of coins was a powerful forerunner to computer simulation -- the students could understand that many runs (those not starting with HHHH) had been omitted. The computer simulation reinforced the idea of expected value as they could see that one run had 13 heads after it, another run three heads. The empirical evidence appeared to be much more powerful than intellectualising through the tree diagram. The tree diagram served more as a reinforcement of the simulations and as a model to facilitate the development of a logical explanation. From this experiment students became aware of the tacit intuitive models that were causing conflict in their thinking. This is apparent in the following quotes:
S: ``In the coin tossing problem because four heads come up, intuitively I wanted to think it would be likely a tail would come up. I know though that statistically the next toss could be equally [likely] heads or tails.''
S: ``Particularly enlightening is the demonstration of the confusion of two concepts with the problem of `what are the expectations after four heads' example, in that I expected the results to even out over the long run without recognising the conditional part of `given that four heads have already occurred'.''
S: ``Seeing the tree really helped me in this area.''
37 Three weeks after the one-day course, a second interview took place to further investigate the students' statistical thinking, beliefs, and intuitions. The procedure was similar to the first interview. The students were each interviewed for approximately one hour. The questions were presented orally and/or on paper depending on the nature of the question. Again the students were asked to `think aloud' and unplanned probes were used.
38 Some of the items in the interview were:
Coin Question: Your friend tossed a coin five times and got HHHHH. She said that she expected the next toss to be a tail. Explain to your friend why she thinks that way.
Weather Question (adapted from Konold 1989): On TV3 the weather forecast for rain in different areas is always expressed as percentages. If the forecast for Auckland tomorrow is a 70% chance of rain, what does the number tell you?
Disastrous Day Question (from Konold 1989): I was told this story about a person's disastrous day. First his son wrecked the family car and was seriously injured. Next, he was late for work and nearly got dismissed. In the afternoon he got food poisoning at a fast-food restaurant. Then in the evening he got word that his father had died. How would you account for all these things happening on the same day?
Traffic Accident Question: On average there are 600 deaths due to traffic accidents each year in New Zealand. A person observed the following:
                            Number of Deaths
          February Week 1:         3
                   Week 2:         12
                   Week 3:         21
                   Week 4:         14
          March    Week 5:         2
Assume that none of these weeks contain a holiday weekend. Suppose the headlines in the newspaper claimed that week three was a `black' week and police reported that speed was a factor. The next week was described in the papers as more evidence that New Zealand driving was deteriorating. At the end of week five the police congratulated themselves for the low death rate -- their extra patrols had succeeded. What would you say to this person?
Error Rate Question: In a firm in Wellington the management was concerned at the number of errors that office staff were making in transactions. The four office staff were audited every day over a month and the box-and-whisker plots shown were obtained (Figure 3). If you were the manager and had been presented with this graph what would you think?
 Figure 3. (5.6K gif)
Figure 3. Error Rate Question.
39 From responses to these questions it appears that some students had become more aware of their own thinking and were prepared to think probabilistically about each situation. This may have been to due to the nature of the questions in the second interview, but their comments clearly indicate a heightened awareness of probabilistic thinking, perhaps to the extent of almost rejecting deterministic thinking, which was not the intention of the intervention. At the end of the second interview a student observed:
S: ``Because this [interview] was a `test' situation I could feel myself reverting to my original thinking -- deterministic -- this other way, statistical thinking is new. I was aware I was relying on what was familiar.''
During the interview on the Traffic Accident Question she said:
S: ``I know that you are saying to me: `Discount those things [causes] and look at general variability'.''
40 Another student, after struggling with the Weather Question, commented in frustration:
S: ``I'm also thinking about it in a more, I guess, general way rather than a statistical way I suppose.''
41 Comments from a third student as she went through the interview seemed to indicate that she was aware of her thinking. On the Coin Question she reported:
S: ``Must say intuitively though I still think she must get it ... it should come out eventually. If I got 10 heads in 10 tosses I would think that this is very strange ... that is why in that question I do have a conflict in thinking.''
42 For the Weather Question she got confused about the interpretation of 70% chance of rain each day and raining 7 days out of 10 days. Eventually through reasoning aloud she clarified her thinking and correctly interpreted the questions.
I: ``... 70% chance of rain each day did not have that meaning for you before?''
S: ``[It] did initially and then I thought, is that just what I am intuitively thinking or is that really what they are saying?''
She appeared to be checking out her thinking, aware that she may be holding incorrect tacit intuitive models.
43 For the Disastrous Day Question she sorted out possible dependent and independent events, commenting:
S: ``[It is] just by chance [that] the unrelated events happened ... [it is] not outstandingly unlikely all things happening on the same day.''
44 The Traffic Accident Question, which may have elicited more causal explanations before the course, was immediately treated probabilistically:
S: ``I think I would have to say it was not due to factors or causes, I would say it was just by chance that there happened to be those three weeks when it was quite bad. [There is] too little data to say that there was any cause for those figures on those particular days.''
After expanding on this further she was asked:
I: ``What would be sufficient evidence for you to accept that it was just variation?''
S: ``If I got a longer period of time and the pattern was fairly even ... I guess for the rest of the year every week was only one or two and those figures really stood out as being really remarkable. I would probably want to check whether it was rain or [whether] one particular accident involved a group of cars [or if it was] just normal variation.''
45 For the Error Rate Question this student felt that the variation between the workers was high, and she expressed interest in examining their working conditions. She was, however, aware that variation would always be present and explained the error rate for worker D as follows:
S: ``Well I think you have to expect that there will be errors.''
46 These responses were typical for four of the students. Apparently each of these students was able to think probabilistically except in the Error Rate Question where they appropriately focussed first on deterministic thinking. The students now appeared to expect variation as a natural part of data.
47 One student was strongly deterministic in every situation. She wove a rather convoluted story around the Disastrous Day Question to account for the sequence of events rather than thinking probabilistically. Often students will find patterns in events where they might not exist; hence, students need to know that such situations may have many interpretations based on thinking probabilistically and/or deterministically. For the Traffic Accident Question, causes dominated her explanation:
S: ``I would want to know `Did it rain in week three?' -- traffic always goes insane if there is one drop of rain especially after a long dry period.''
Repeated probing in other questions produced some probabilistic thinking but she eventually changed back to causal thinking.
48 With coin-based problems, students explained their answers by invoking probabilistic reasoning. However, being unable to reconcile this probabilistic approach with their fundamental intuitions, they seemed to be uncomfortable with such thinking. Students were unable to give a logical explanation for their probabilistic argument. In all real data situations (other than those transparently similar to coin-type problems) probabilistic thinking rarely entered the students' minds. Situations were resolved with causal explanations and the students drew on their own experience to explain the `numbers.' Tversky and Kahneman (1982) note this lack of awareness about variation: ``Statistical principles are not learned from everyday experience because the relevant instances are not coded appropriately'' (p. 18).
49 Mason (1989) asserts that the ``education of awareness comes from having your attention drawn to significant details'' (p. 7). He says the role of the teacher is to engage students in activities that are designed to evoke awareness: ``A teacher cannot shift a student's attention, nor cause them to see in a new way, but a teacher can attract attention to what is important, and away from what is irrelevant to current concerns; they can draw attention to multiplicity of perspective and interpretation, and through their own behaviour, model the sought after way of seeing'' (p. 8).
50 This implies that drawing the students' attention to the omnipresence of variation would enable them to become more aware of that phenomenon. And perhaps asking them to consider situations from a non-deterministic perspective would improve their probabilistic thinking. Similarly it may be possible, through experiment and logical explanation, to raise their awareness of the tacit intuitive models that lead them astray.
51 Singer and Willett's (1993) idea of ``cognitive apprenticeship'' may work if the teacher knows how the individual learner thinks. From this knowledge, authentic activities that allow the individual to be confronted with his/her misconceptions, can be constructed. Our experience in Phase Two is supported by Konold (1991) who states, ``If instruction in probability is to be effective the teacher will need not only to be attuned to students' intuitions but to structure activities that encourage students to evaluate those intuitions'' (p. 152).
52 The first phase of our study revealed all five students had a tendency towards overly deterministic thinking, reflecting their lack of awareness or understanding of variation. Probabilistic thinking was not often apparent in their repertoire of problem-solving strategies. Through our being aware of these students' misconceptions and through studying the literature, it was possible to design activities to challenge their intuitions in Phase Two. It appeared that the use of experiments and computer simulations enabled these students to increase their understanding of variation. The third phase showed initial evidence that it is possible to attract students' attention to a probabilistic perspective.
53 Both sets of interviews provided valuable insight into the five students' intuitions about probability and variation, and our intention is to use a similar approach in the follow-up study. Improvement and analysis of tasks, refining the interview protocol, and analysis of interviewee's thinking will be addressed through the use of more structured processes (Lesh and Kelly 1994; Scholz 1991). In terms of building on and challenging students' intuitions about probability, a one-day course was insufficient. More time will be dedicated to this in the follow-up study and a more refined framework or teaching/learning model for stochastic instruction will be incorporated.
54 Our future larger study will focus on teaching probabilistic and deterministic ideas in the context of statistics, with an emphasis on experiencing and explaining random and systematic variation. A key issue will be developing students' awareness of their thinking.
Biehler, R. (1989), ``Educational Perspectives on Exploratory Data Analysis,'' in Studies in Mathematics Education: The Teaching of Statistics, ed. R. Morris, Vol. 7, France: UNESCO, pp. 185-201.
Borovcnik, M. (1990), ``A Complementarity Between Intuitions and Mathematics,'' in Proceedings of the Third International Conference on Teaching Statistics, Netherlands: ISI Publications, pp. 363-369.
Borovcnik, M. and Bentz, H.-J. (1991), ``Empirical Research in Understanding Probability,'' in Chance Encounters: Probability in Education, eds. R. Kapadia and M. Borovcnik, Netherlands: Kluwer Academic Publishers, pp. 73-105.
Falk, R. and Konold, C. (1992), ``The Psychology of Learning Probability,'' in Statistics for the Twenty-First Century, eds. Florence Gordon and Sheldon Gordon, MAA Notes No. 26, Washington: Mathematical Association of America, pp. 151-164.
Fischbein, E. (1987), Intuition in Science and Mathematics, Dordrecht: D. Reidel.
Garfield, J. and Ahlgren, A. (1988), ``Difficulties in Learning Basic Concepts in Probability and Statistics: Implications for Research,'' Journal for Research in Mathematics Education, 19(1), 44-63.
Konold, C. (1989), ``Informal Conceptions of Probability,'' Cognition and Instruction, 6(1), 59-98.
----- (1991), ``Understanding Students' Beliefs About Probability,'' in Radical Constructivism in Mathematics Education, ed. E. von Glasersfeld, Netherlands: Kluwer Academic Publishers, pp. 139-156.
Lesh, R., and Kelly, A. (1994), ``Action-Theoretic and Phenomenological Approaches to Research in Mathematics Education: Studies of Continually Developing Experts,'' in Didactics of Mathematics As A Scientific Discipline, eds. R. Biehler, R. W. Scholz, R. Strasser, and B. Winkelmann, Netherlands: Kluwer Academic Publishers, pp. 277-286.
Lovitt, C. and Lowe, I. (1993), Chance and Data Investigations, Australia: Curriculum Corporation.
Mason, J. (1989), ``What Exactly Can A Teacher Do?,'' unpublished manuscript, Open University.
Moore, D. S. (1990), ``Uncertainty,'' in On the Shoulders of Giants: New Approaches to Numeracy, ed. L. A. Steen, Washington: National Academy Press, pp. 95-137.
----- (1992), ``Teaching Statistics as a Respectable Subject,'' in Statistics for the Twenty-First Century, eds. Florence Gordon and Sheldon Gordon, MAA Notes No. 26, Washington: Mathematical Association of America, pp. 14-25.
Scholz, R. W. (1991), ``Psychological Research in Probabilistic Understanding,'' in Chance Encounters: Probability in Education, eds. R. Kapadia and M. Borovcnik, Netherlands: Kluwer Academic Publishers, pp. 213-254.
Singer, J. and Willett, J. (1993), ``Lessons We Can Learn from Recent Research on Teaching: It's Not Just the Form, It's the Authenticity,'' paper presented at the 1993 Joint Statistical Meetings, San Francisco, CA.
Tversky, A. and Kahneman, D. (1982), ``Judgment Under Uncertainty: Heuristics and Biases,'' in Judgment Under Uncertainty: Heuristics and Biases, eds. D. Kahneman, P. Slovic, and A. Tversky, New York: Cambridge University Press, pp. 3-20 (originally published in Science (1974), 185, 1124-1131).